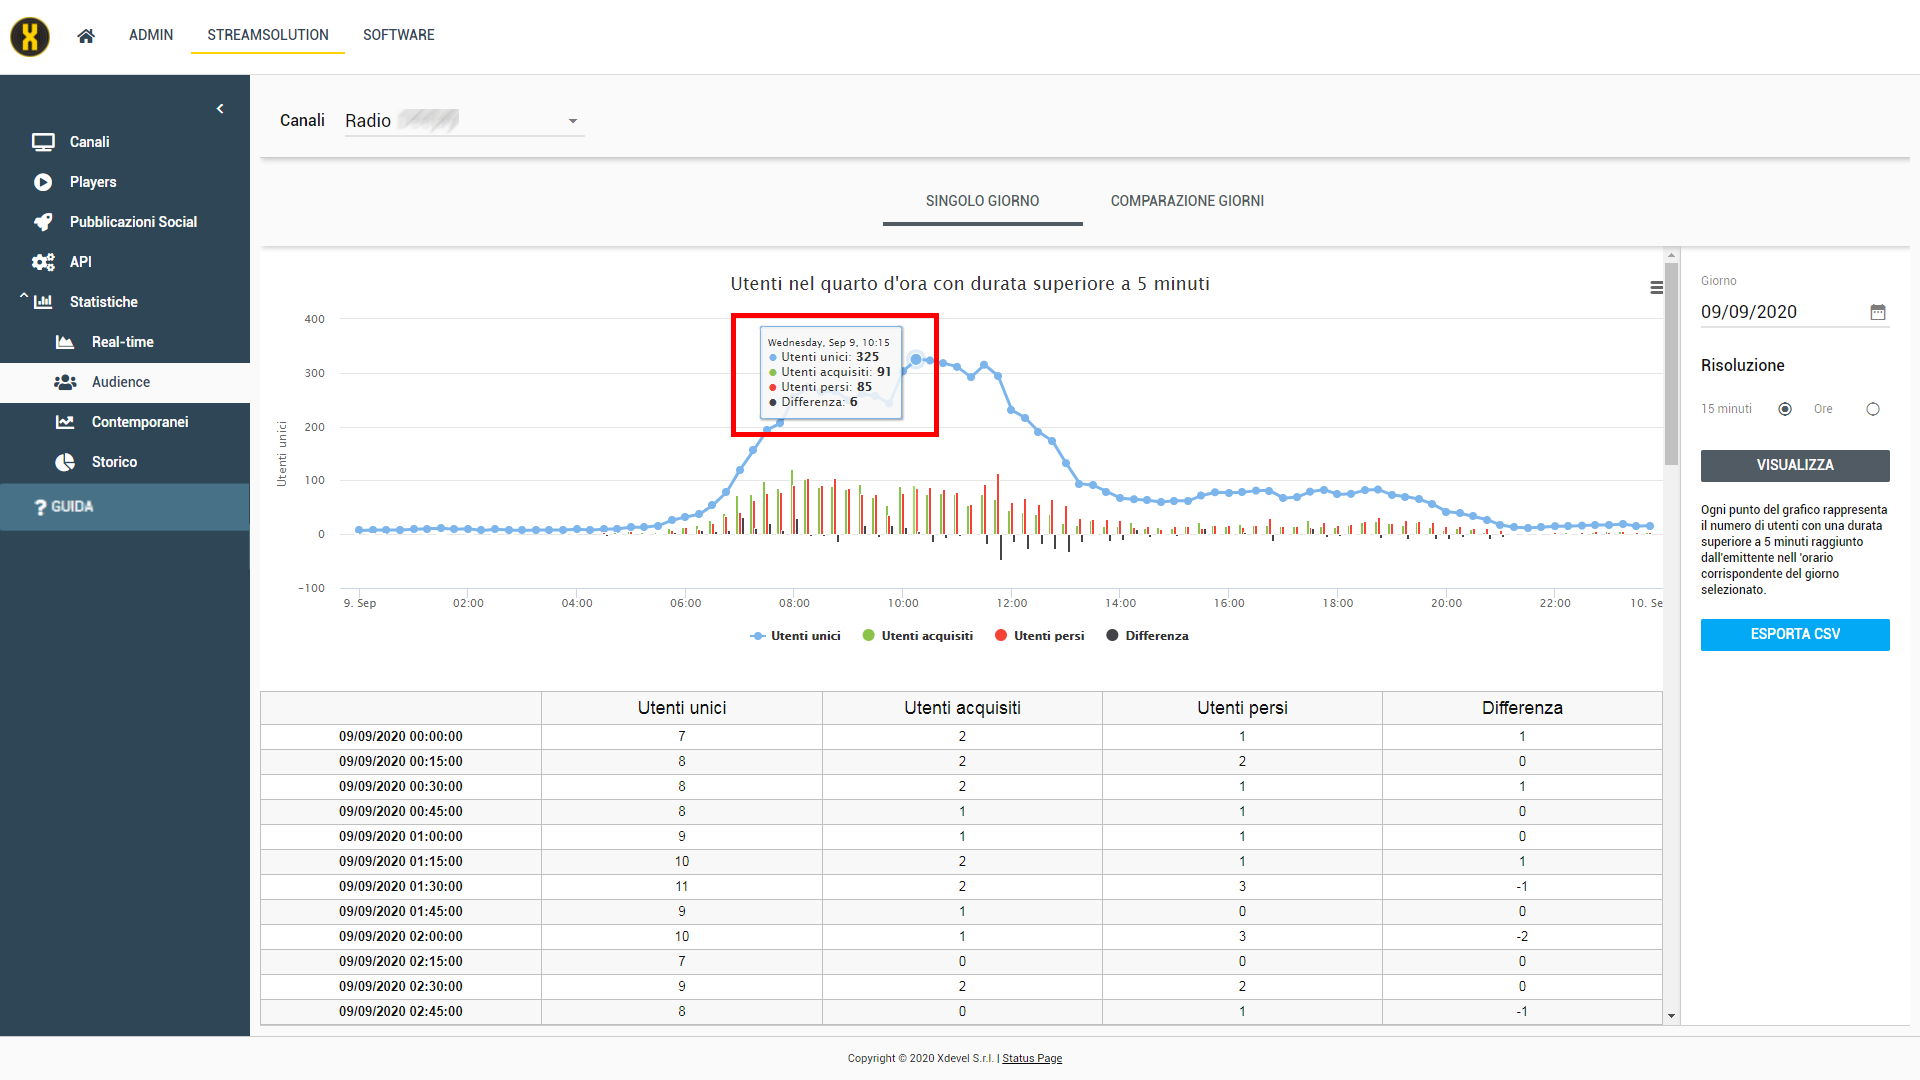
On this page it is possible to check in detail the positive or negative trend of the selected channel in a single day or by comparing several days.
In the Single Day tab, the trend of the selected day is graphed on the basis of unique users, acquired users, lost users and the difference.
The grid below lists the data according to the resolution set.
It is possible to modify the day to be analyzed through the calendar and to change the resolution of the graph by choosing between 15 minutes and 1 hour.
If you want to export the grid data click Export CSV.
Definition:
Unique users: all users who in the quarter of an hour in question remain connected to the channel for more than 5 minutes.
Acquired users: all users who connect to the channel in the quarter of an hour in question and who were not present in the previous 15 minutes.
Lost users: all users who disconnected from the channel in the quarter of an hour in question and who were present in the previous 15 minutes.
Difference: it is given by the difference between acquired users and lost users. The positive or negative value allows you to understand the trend in the quarter of an hour in question.

